Figures
FIGURES AT A GLANCE
| in CHF mn | 2019 | 2020 | Change 2019/2020 |
|---|---|---|---|
| Order intake | |||
| – Systems Division | 361.2 | 404.6 | 12.0% |
| – Services Division | 246.1 | 272.1 | 10.5% |
| Total | 607.3 | 676.6 | 11.4% |
| Sales and gross profit | |||
| Systems Division | |||
| Sales | 388.3 | 409.8 | 5.5% |
| Gross profit | 42.8 | 59.1 | 38.1% |
| in % of sales | 11.0% | 14.4% | |
| Services Division | |||
| Sales | 241.3 | 248.8 | 3.1% |
| Gross profit | 107 | 107.1 | 0.1% |
| in % of sales | 44.3% | 43.0% | |
| Total | |||
| Sales | 629.6 | 658.6 | 4.6% |
| Gross profit | 149.8 | 166.2 | 10.9% |
| in % of sales | 23.8% | 25.2% | |
| Operating income (EBIT) | |||
| Systems Division | 6.4 | 16.2 | 151.2% |
| in % of sales | 1.7% | 3.9% | |
| Services Division | 54.7 | 51.2 | -6.3% |
| in % of sales | 22.7% | 20.6% | |
| Total | 54.8 | 60.8 | 11.0% |
| in % of sales | 8.7% | 9.2% | |
| Net income | 39.9 | 47.2 | 18.4% |
| in % of sales | 6.3% | 7.2% | |
| Depreciation and amortization | 20.5 | 21.1 | 2.7% |
| Cash flow | |||
| – from operating activities | 50.7 | 132.2 | 160.7% |
| – from investing activities | -49.7 | -40.4 | |
| – from financing activities (incl. translation differences) | 6.3 | -106.7 | |
| Total | 7.3 | -14.9 | |
| Total balance sheet assets | 883 | 797.5 | -9.7% |
| Non-current assets | 234.1 | 211 | -9.9% |
| Current assets | 648.9 | 586.5 | -9.6% |
| Shareholders’ equity | 317.5 | 219.6 | -30.8% |
| in % of total balance sheet assets | 36.0% | 27.5% | |
| Net financial position (in CHF mn) | -91.7 | -82.4 | |
| Headcount as per end of fiscal year (full-time equivalents) | 2’621 | 2’538 | -3.2% |
| Total remuneration Board of Directors (in TCHF) | 573 | 610 | 6.5% |
| Total remuneration Executive Board (in TCHF) | 2’893 | 3’147 | 8.4% |
| Share price as per end of fiscal year (in CHF) | 192.4 | 315 | 63.7% |
| Market capitalization (in CHF mn) | 654.2 | 1’071 | 63.7% |
| Market capitalization/shareholders’ equity (ratio) | 2.1 | 4.9 | 136.7% |
| Net income per share (EPS) (in CHF) | 9.56 | 13 | 36.0% |
| Dividend per share (in CHF) | 6 | 6.501 | 8.3% |
| Number of issued shares | 3’400’000 | 3’400’000 |
1 Motion to the Annual General Meeting
Order intake

Sales

Operating income

Net income

Shareholders’ equity

Net financial position

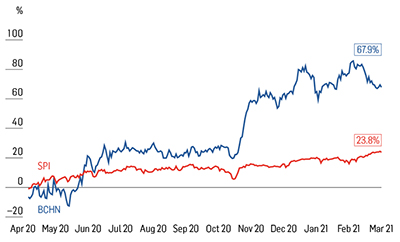
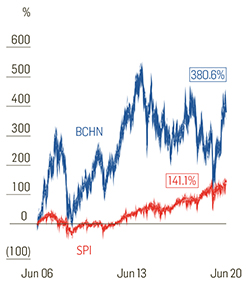
TOTAL SHAREHOLDER RETURN
SINCE IPO
FISCAL YEAR 2020